A Tool to Plan, Visualize, Estimate, and Simplify Subway Networks
Subway Builder

OVERVIEW
Connect with maps and database to aquire data on Traffic volume and population. Easily view all the factors determining the traffic flow reduction and cost on a single platform. Create and compare multiple solutions for the same city. Take decisions easily. Convince stakeholders with accurate information. Easily export the detailed report.
ROLE & DURATION
User Experience Designer
Interaction, Visual design and prototyping
5 Hours
This project was done as a part of a design task.
The Problem
When creating a subway system, there are many factors to consider which is often overwhelming for a transportation engineer.
The Information is displayed across different applications, and it is hard to understand their relationship. Also it is very hard to compare different solutions.
Design a tool to be used by the transportation engineer to help the process of subway system design.
The Outcome and Key features
The Subway Builder is designed to help transportation engineers efficiently plan, analyze, and propose subway systems. It includes advanced features to enhance decision-making and stakeholder communication.

Visionary Design Approach
Includes future-focused features such as a 3D visualizer, component builder, and schedule generator.


Integrated Data Acquisition
Connects with maps and databases to gather traffic volume, population, and cost estimation data.
AI recommendations
Provides intelligent station and junction placement suggestions.


Comparative Analysis
Engineers can create and compare multiple subway solutions for the same city.
Advanced Visualization
Displays critical factors, such as traffic flow reduction and cost implications, on a unified platform

Process
1. Understanding the Problem: Reviewed provided research insights and conducted additional research on subway system planning.
2. Competitor Benchmarking: Analyzed existing tools to identify gaps and best practices.
3. Defining User Needs: Mapped out the core pain points and prioritized key functionalities.
4. Wireframing & Prototyping: Created low-fidelity wireframes to outline workflows and then developed high-fidelity screens for review.
5. Prioritization & Refinement: Focused on the most impactful features due to the limited timeframe.
User Scenario Map
As the user persona was provided with the design problem, I had a clear understanding of the users. The focus of this design challenge, the steps of 'creating solution' (subway network design) and 'comparing solutions were considered and a user scenario was mapped out.
It helped me understand the steps better and ideate solutions at a fast pace.

“Auria creating subway network system for a city”
View in Figjam: User Scenario Map
Creating this helped in identifying the possible steps. Also it helped to think about the possible interactions at each step, and document the thoughts and comments at each stage. This also enabled ideating for each of the steps.
User Flow Diagrams
To ideate, a high level user flow diagram was created, taking insights from the scenario mapping.

View in Figjam: User Flow Diagrams
Conceptualization
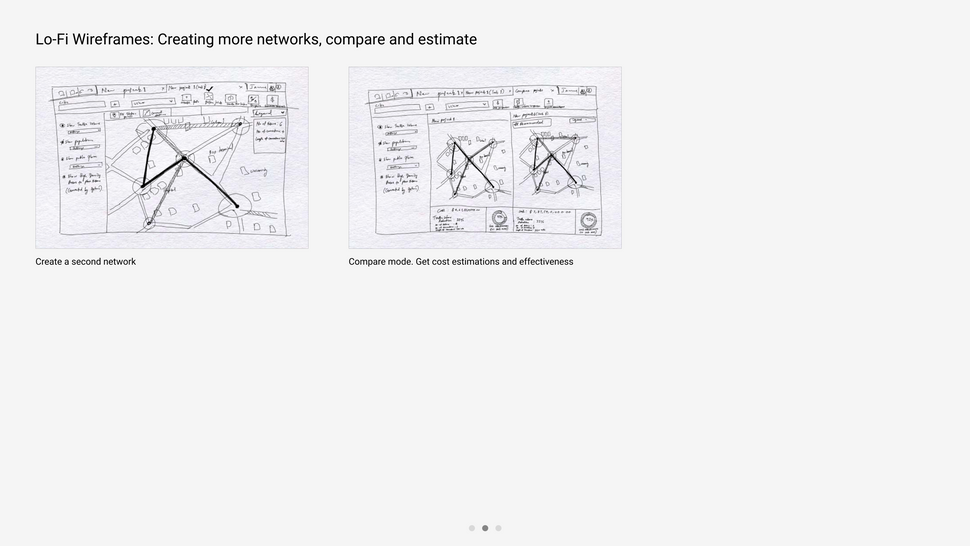
Low fidelity and mid fidelity wireframes were sketched out. Once the mid fidelity wireframes were finalized for the layout and flow, high fidelity wireframes were created and prototyping was done on the same.
Key learnings and Takeaways
-
Data-heavy applications require a balance between usability and technical depth.
-
Engineers need flexibility, but clear visual representations enhance efficiency.
-
Time-constrained design tasks benefit from a structured, high-impact approach.
-
The role of AI in design and its potential impact on transportation planning remains an evolving question (as of 2022).


